
Wednesday 10 February 2016
ECG Module on Myocardial Infarction & Ischaemia
http://www.cardiorhythmsonline.co.uk/collections/e-learning-modules/products/the-ecg-in-myocardial-infarction-ischaemia


R-wave Progression

- normal R-wave progression in the praecordial leads
- normal chest lead ECG shows an rS-type complex in lead V1 with a steady increase in the relative size of the R-wave toward the left chest and a decrease in the S wave amplitude. Leads V5 and V6 generally show a qR-type complex, with R-wave amplitude in V5 often taller than V6 because of the attenuating effect of the lungs. Normal variations include: narrow QS and rSr patterns in V1 and qRs and R patterns in V5 and V6
- at some point, generally around the V3 or V4 position, the QRS complex changes from predominately negative to predominately positive and the R/S ratio becomes>1. This is known as the transition zone. In some normal individuals, the transition may be seen as early as V2. This is called early transition. At times, transition may be delayed until V4 to V5. This is called delayed transition
- normal R-wave height in V3 is usually greater than 2 mm
- if the height of the r wave in leads V1 to V4 remains extremely small, we say there is "poor R-wave progression" In the literature, definitions of poor R-wave progression have been variable, using criteria such as R-wave less than 2-4 mm in leads V3 or V4 and/or the presence of reversed R-wave progression defined as R in V4
- poor R wave progression secondary to previous anterior myocardial infarction
- in anterior myocardial infarctions, this produces Q waves in the right and midprecordial leads (V1-V4)
- however, in a significant number of patients the Q waves do not persist
- with previously documented anterior myocardial infarction, the reported estimate of poor Rwave progression on subsequent ECGs varies between 20% and 30%
- average length of time for the complete disappearance of the abnormal Q waves is 1.5 years
- the magnitude of the subsequent leftward forces is less than in patients with poor Rwave progression from other causes
- on the ECG, this results in a diminuation of R-wave amplitude in standard lead I
- in anterior myocardial infarctions, this produces Q waves in the right and midprecordial leads (V1-V4)


ST depression & T wave inversion causes

- LVH with strain pattern
- WPW with pre-excitation
- Right Ventricular Hypertrophy (RVH)
- Digitalis
- Subarachnoid Hemorrhage/CVA
- Posterior STEMI
- Ischemia (lead with upright QRS)
- Ischemia (wellen's patterns)
- Right Bundle Branch Block (RBBB)
- Left Bundle Branch Block (LBBB)


P wave Abnormalities

- Right Atrial Enlargement (RAE) or (p Pulmonale)
- Left Atrial Enlargement (LAE) or (p Mitrale)
- Right + Left Atrial Enlargement (p Biatriale)
Cardiac Axis Made Easy


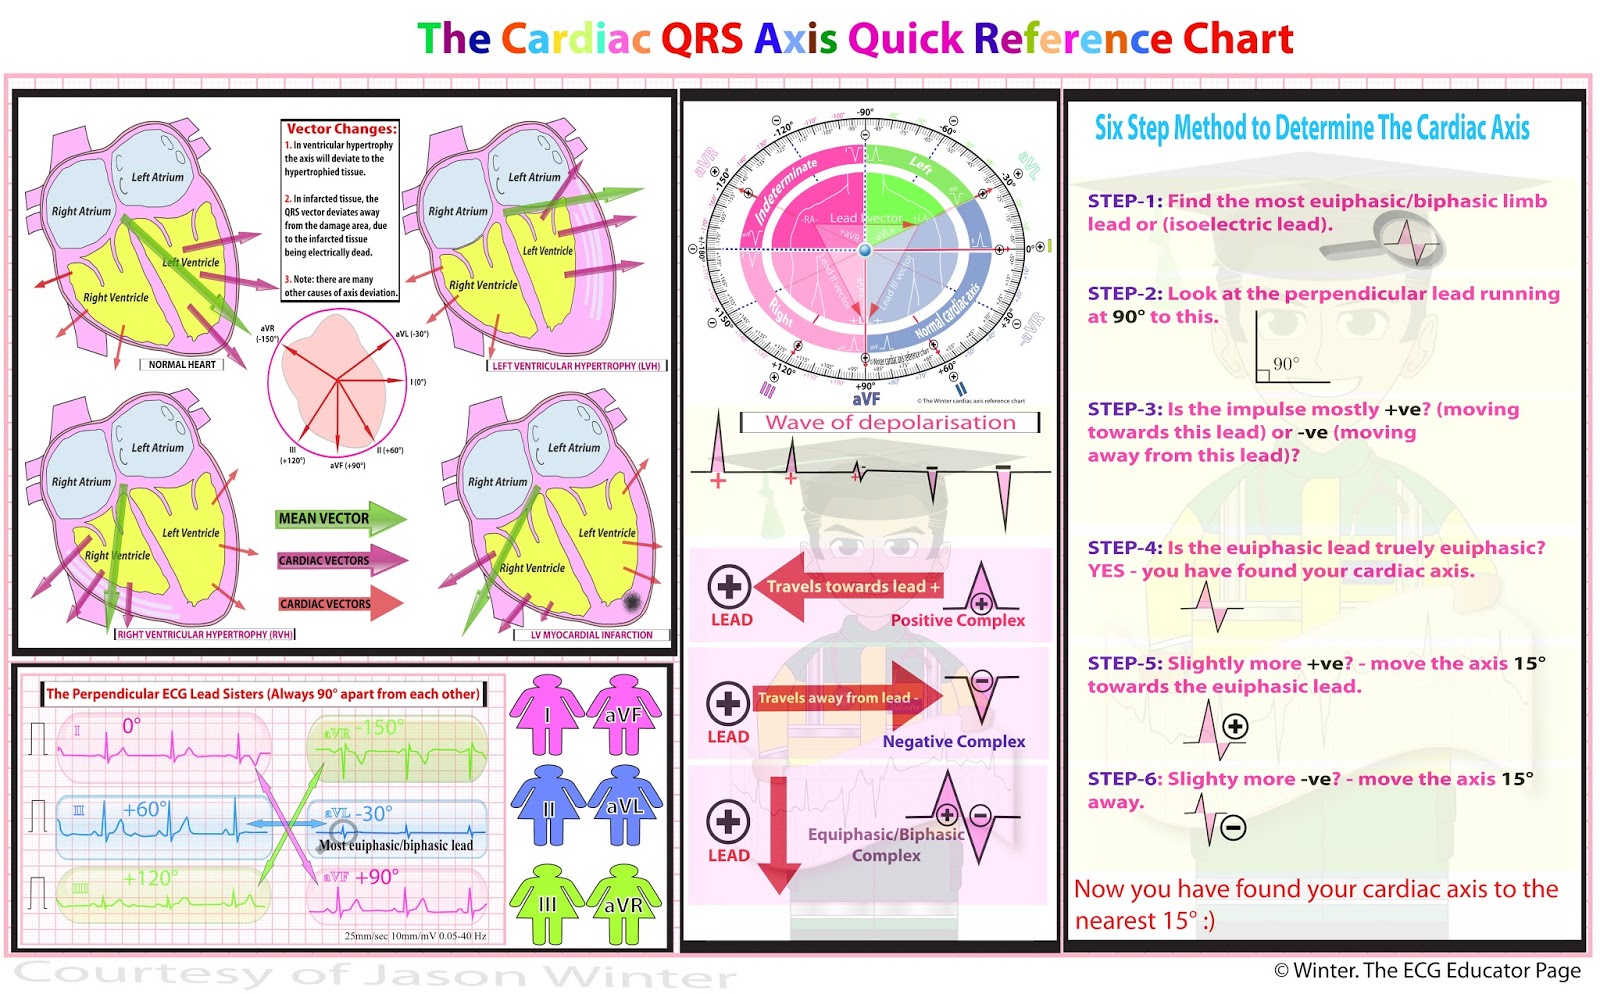


Normal Axis = QRS axis between -30 and +90 degrees.
Left Axis Deviation = QRS axis less than -30 degrees.
Right Axis Deviation = QRS axis greater than +90 degrees.
Extreme Axis Deviation = QRS axis between -90 and 180 degrees.


Heart Blocks


First Degree AV Block


Second Degree AV Block - Type 1 (wenckebach)


Second Degree AV Block - Mobitz Type 2


3rd Degree AV Block (Complete Heart Block)


Ventricular Ectopics

NSR with isolated PVC


Multifocal PVC's


NSR with Ventricular Couplets


Ventricular Triplets (salvo)


Ventricular Bigeminy


Ventricular Trigeminy


Ventricular Quadrigeminy


Ventricular Pentageminy


Ventricular Hexageminy


Subscribe to:
Posts (Atom)